7 Surprising Innovations For The Future Of Computing

side_a_image_15_cropped-e1467313747321

Moore’s Law posits that the number of transistors on a microprocessor — and therefore their computing power — will double every two years. It’s held true since Gordon Moore came up with it in 1965, but its imminent end has been predicted for years. As long ago as 2000, the MIT Technology Review raised a warning about the limits of how small and fast silicon technology can get.

The thing is, Moore’s Law isn’t really a law. It’s more of a self-fulfilling prophecy. Moore didn’t describe an immutable truth, like gravity or the conservation of momentum. He simply set our expectations, and lo, the chip makers delivered accordingly.

In fact, the industry keeps finding new ways to pack more power onto tinier chips. Unfortunately, they haven’t found ways to cut costs on the same exponential curve. As Fast Company reported in February 2016, the worldwide semiconductor industry is no longer planning to base its R&D plans for silicon chips around the notion of doubling their power every two years, because it simply can’t afford to keep up that pace in purchasing the incredibly complex manufacturing tools and processes necessary. Besides, current manufacturing technology may not be able to shrink silicon transistors much more than it already has. And in any event, transistors have become so tiny that they may no longer reliably follow the usual laws of physics — which raises questions about how much longer we’ll dare to use them in medical devices or nuclear plants.

So does that mean the era of exponential tech-driven change is about to come to a screeching halt?

Not at all.

Even if silicon chips are approaching their physical and economic limits, there are other ways to continue the exponential growth of computing performance, from new materials for chips to new ways to define computing itself. We’re already seeing technological advances that have nothing to do with transistor speed, like more clever software driven by deep learning and the ability to achieve greater computing power by leveraging cloud resources. And that’s only the tiniest hint of what’s coming next.

Here are a few of the emerging technologies that promise to keep computing performance rocketing ahead:

  • In-memory computing. Throughout computing history, the slowest part of processing has been getting the data from the hard disks where it’s stored to random access memory (RAM), where it can be used. A lot of processor power is wasted simply waiting for data to arrive. By contrast, in-memory computing puts massive amounts of data into RAM where it can be processed immediately. Combined with new database, analytics, and systems designs, it can dramatically improve both performance and overall costs.
  • Graphene-based microchips. Graphene — one molecule thick and more conductive than any other known material (see The Super Materials Revolution) — can be rolled up into tiny tubes or combined with other materials to move electrons faster, in less space, than even the smallest silicon transistor. This will extend Moore’s Law for microprocessors a few years longer.
  • Quantum computing. Even the most sophisticated conventional computer can only assign a one or a zero to each bit. Quantum computing, by contrast, uses quantum bits, or Qubits, which can be a zero, a one, both at once, or some point in between, all at the same time. (See this explainer video from the Verge for a surprisingly understandable overview.) Theoretically, a quantum computer will be able to solve highly complex problems, like analyzing genetic data or testing aircraft systems, millions of times faster than currently possible. Google researchers announced in 2015 that they had developed a new way for qubits to detect and protect against errors, but that’s as close as we’ve come so far.
  • Molecular electronics. Researchers at Sweden’s Lund University have used nanotechnology to build a “biocomputer” that can perform parallel calculations by moving multiple protein filaments simultaneously along nanoscopic artificial pathways. This biocomputer is faster than conventional electrical computers that operate sequentially, approximately 99 percent more energy-efficient, and cheaper than both conventional and quantum computers to produce and use. It’s also more likely to be commercialized soon than quantum computing is.
  • DNA data storage. Convert data to base 4 and you can encode it on synthetic DNA. Why would we want to do that? Simple: a little bit of DNA stores a whole lot of information. In fact, a group of Swiss researchers speculate that about a teaspoon of DNA could hold all the data humans have generated to date, from the first cave drawings to yesterday’s Facebook status updates. It currently takes a lot of time and money, but gene editing may be the future of big data: Futurism recently reported that Microsoft is investigating the use of synthetic DNA for secure long-term data storage and has been able to encode and recover 100 percent of its initial test data.
  • Neuromorphic computing. The goal of neuromorphic technology is to create a computer that’s like the human brain—able to process and learn from data as quickly as the data is generated. So far, we’ve developed chips that train and execute neural networks for deep learning, and that’s a step in the right direction. General Vision’s neuromorphic chip, for example, consists of 1,024 neurons — each one a 256-byte memory based on SRAM combined with 3,000 logic gates — all interconnected and working in parallel.
  • Passive Wi-fi. A team of computer scientists and electrical engineers at the University of Washington has developed a way to generate Wi-fi transmissions that use 10,000 times less power than the current battery-draining standard. While this isn’t technically an increase in computing power, it is an exponential increase in connectivity, which will enable other types of advances. Dubbed one of the 10 breakthrough technologies of 2016 by MIT Technology Review, Passive Wi-fi will not only save battery life, but enable a minimal-power Internet of Things, allow previously power-hungry devices to connect via Wi-fi for the first time, and potentially create entirely new modes of communication.

So while we may be approaching the limits of what silicon chips can do, technology itself is still accelerating. It’s unlikely to stop being the driving force in modern life. If anything, its influence will only increase as new computing technologies push robotics, artificial intelligence, virtual reality, nanotechnology, and other world-shaking advances past today’s accepted limits.

In short, exponential growth in computing may not be able to go on forever, but its end is still much farther in the future than we might think.

How to Rewire the Organization for the Internet of Things

feature_images_isbel_qa-730x300

Success in the IoT requires new levels of speed, agility, and flexibility, not just from the systems delivering IoT services but also from the people charged with making those services happen.

Hyperconnectivity, the concept synonymous with the Internet of Things (IoT), is the emerging face of IT in which applications, machine-based sensors, and high-speed networks merge to create constantly updated streams of data. Hyperconnectivity can enable new business processes and services and help companies make better day-to-day decisions. In a recent survey by the Economist Intelligence Unit, 6 of 10 CIOs said that not being able to adapt for hyperconnectivity is a “grave risk” to
their business.

IoT_Isbel_QA02IoT technologies are beginning to drive new competitive advantage by helping consumers manage their lives (Amazon Echo), save money (Ôasys water usage monitoring), and secure their homes (August Smart Lock). The IoT also has the potential to save lives. In healthcare, this means streaming data from patient monitoring devices to keep caregivers informed of critical indicators or preventing equipment failures in the ER. In manufacturing, the IoT helps drive down the cost of production through real-time alerts on the shop floor that indicate machine issues and automatically correct problems. That means lower costs for consumers.

Several experts from the IT world share their ideas on the challenges and opportunities in this rapidly expanding sector.

qa_qWhere are the most exciting and viable opportunities right now for companies looking into IoT strategies to drive their business?

Mike Kavis: The best use case is optimizing manufacturing by knowing immediately what machines or parts need maintenance, which can improve quality and achieve faster time to market. Agriculture is all over this as well. Farms are looking at how they can collect information about the environment to optimize yield. Even insurance companies are getting more information about their customers and delivering custom solutions. Pricing is related to risk, and in the past that has been linked to demographics. If you are a teenager, you are automatically deemed a higher risk, but now providers can tap into usage data on how the vehicle is being driven and give you a lower rate if you present a lower risk. That can be a competitive advantage.

Dinesh Sharma: Let me give you an example from mining. If you have sensored power tools and you have a full real-time view of your assets, you can position them in the appropriate places. Wearable technology lets you know where the people who might need these tools are, which then enables more efficient use of your assets. The mine is more efficient, which means reduced costs, and that ultimately results in a margin advantage over your competition. Over time, the competitive advantage will build and there will be more money to invest in further digital transformation capabilities. Meanwhile, other mining companies that aren’t investing in these technologies fall further behind.

qa_qWith the IoT, how should CIOs and other executives think and act differently?

Martha Heller: The points of connection between IT and the business should be as strategic and consultative as possible. For example, the folks from IT who work directly with R&D, marketing, and data scientists should be unencumbered with issues such as network reliability, help desk issues, and application support. Their job is to be a business leader and to focus on innovative ideas, not to worry for an instant about “Oh your e-mail isn’t working?” There’s also obviously the need for speed and agility. We’ve got to find a way to transform a business idea into something that the businessperson can touch and feel as quickly as possible.

Greg Kahn: Companies are realizing that they need to partner with others to move the IoT promise forward. It’s not feasible that one company can create an entire ecosystem on their own. After all, a consumer might own a Dell laptop, a Samsung TV, an Apple watch, a Nest device, an August Smart Lock, and a Whirlpool refrigerator.

It is highly unrealistic to think that consumers will exchange all of their electronic equipment and appliances for new “connected devices.” They are more likely to accept bridge solutions (such as what Amazon is offering with its Dash Replenishment Service and Echo) that supplement existing products. CIOs and other C-suite executives will need to embrace partnerships boldly and spend considerable time strategizing with like-minded individuals at other companies. They should also consider setting up internal venture arms or accelerators as a way to develop new solutions to challenges that the IoT will bring.

qa_qWhat is the emerging technology strategy for effectively enabling the IoT?

Kavis: IT organizations are still torn between DIY cloud and public cloud, yet with the IoT and the petabytes of data being produced, it changes the thinking. Is it really economical to build this on your own when you can get the storage for pennies in the cloud? The IoT also requires a different architecture that is highly distributed, can process high volumes of data, and has high availability to manage real-time data streaming.

On-premise systems aren’t really made for these challenges, whereas the public cloud is built for autoscaling. The hardest part is connecting all the sensors and securing them. Cloud providers, however, are bringing to market IoT platforms that connect the sensors to the cloud infrastructure, so developers can start creating business logic and applications on top of the data. Vendors are taking care of the IT plumbing of getting data into the systems and handling all that complexity so the CIO doesn’t need to be the expert.

Kahn: All organizations, regardless of whether they outsource data storage and analysis or keep it in house, need to be ready for the influx of information that’s going to be generated by IoT devices. It is an order of magnitude greater than what we see today. Those that can quickly leverage that data to improve operational efficiency, and consumer engagement will win.

Sharma: The future is going to be characterized by machine interactions with core business systems instead of by human interactions. Having a platform that understands what’s going on inside a store – the traffic near certain products together with point-of-sale data – means we can observe when there’s been a lot of traffic but the product’s just not selling. Or if we can see that certain products are selling well, we can feed that data directly into our supply chain. So without any human interaction, when we start to see changes in buying behavior we can update our predictive models. And if we see traffic increasing in another part of the store in a similar pattern we can refine the algorithm. We can automatically increase supply of the product that’s in the other part of the store. The concept of a core system that runs your process and workflow for your business but is hyperconnected will be essential in the future.

qa_qPrivacy and security are a few of the top concerns with hyperconnectivity. Are there any useful approaches yet?

IoT_Isbel_QA03Kavis: We have a lot less control over what is coming into companies from all these devices, which is creating many more openings for hackers to get inside an organization. There will be specialized security platforms and services to address this, and hardware companies are putting security on sensors in the field. The IoT offers great opportunities for security experts wanting to specialize in this area.

Kahn: The privacy and security issues are not going to be solved anytime soon. Firms will have to learn how to continually develop new defense mechanisms to thwart cyber threats. We’ve seen that play out in the United States. In the past two years, data breaches have occurred at both brick-and-mortar and online retailers. The brick-and-mortar retail industry responded with a new encryption device: the chip card payment reader. I believe it will become a cost of business going forward to continually create new encryption capabilities. I have two immediate suggestions for companies: (1) develop multifactor authentication to limit the threat of cyber attacks, and (2) put protocols in place whereby you can shut down portions of systems quickly if breaches do occur, thereby protecting as much data as possible.

A New Model for Corporate Learning

feature_image_isbel-learn_inquiry-730x300

A slow but steady revolution is occurring in the world of learning. If you have a child between the ages of 5 and 18 living at home, you’re probably seeing it unfold every day. Want to confirm you got your math problem correct? Just ask Siri. Need to understand how weather balloons work for a science project? Check out The Weather Channel Kids Web site. Forgot your homework assignment? Ask a friend to snap it and send it on Instagram.

SAP_Learning-Isbell_INQUIRY_image2400x1600_2The future of learning is here and it’s digital, social, continuous, and highly immersive. For companies, traditional training methods, such as classrooms, are still relevant, but they are no longer the prime delivery method for learning. They are slow to set up, are expensive, and consume too many productive hours. Many companies are beginning to view the classroom as a strategy for customized educational needs, such as corporate strategy or branding.

Static online-learning tools, such as asynchronous simulations and narrated slide decks, are not engaging enough to be effective as a replacement for live training, however. Meanwhile, many employees are unable to keep up with technological advances that affect their everyday work processes. Because knowledge becomes obsolete so quickly, people need continuous, always-on learning.

CGI, a global IT consulting company with 68,000 employees, was struggling with this very problem. Classroom training for consultants couldn’t keep up with the education required to service clients with sophisticated technology needs. CGI adopted a cloud-based learning platform to bridge the gap. The system, which can be personalized to the learner, includes video-based courses and online-learning rooms to foster social learning opportunities with other students and instructors. CGI is now training 50% more consultants, and learners are consuming 50% more training content than in the past.

The move to continuous, on-demand learning is also saving CGI money and enabling it to onboard new consultants faster. “It is a ‘moment of need’ reference tool that helps our employees in their day-to-day tasks,” says Bernd Knobel, a director at CGI.

Workforce and economic drivers for learning transformation

Learning needs are growing across all disciplines of content due to the speed of globalization, competition, and new disruptive business practices. During the fallout from the 2008 global recession, companies scaled back on organizational development, but that’s beginning to change as companies struggle to rebuild their businesses, says Josef Bastian, a senior learning performance consultant with Alteris Group.

The same forces that drove CGI to abandon the classroom are being felt across industries. The main drivers for change include:

1. Creating competitive advantage

SAP_Learning-Isbell_INQUIRY_image175px_1Uber, Netflix, Amazon, Airbnb, Bloom Energy, and health insurer Oscar are among the companies considered highly disruptive in their markets today. They achieved innovation and market share by looking ahead and taking advantage of new technologies faster than competitors or in novel ways. Digital learning enables companies to stay ahead of the curve. Companies need to understand the new technologies before they are even available, so that they can understand the impact on the business and even invent new business models.

2. Closing the skills gap

SAP_Learning-Isbell_INQUIRY_image175px_2We are now in an era that will rival the Industrial Age in terms of transformation. For example, a financial analyst today needs to know how to work with Big Data, including how to ask the right questions and how to use the related information systems. Jim Carroll, a speaker, consultant, and author on business transformation, uses the automotive industry as one rubric for change. “You’ve got folks who are struggling with all this new high-tech gear inside the car or the dashboard,” says Carroll. “And you look at a typical auto dealer or the person manufacturing a car, and the knowledge they need to do their job today is infinitely more complex than it was even 5 or 10 years ago.”

3. Retaining and motivating a new workforce

SAP_Learning-Isbell_INQUIRY_image175px_3By 2025, Millennials will make up 75% of the workforce, according to the Brookings Institution. Various studies have shown that Millennials crave learning and collaboration and will do whatever it takes to get the information they need expediently. “I’ve got two sons who are 20 and 22 and they seem to learn in an entirely new and different way,” Carroll says. “To borrow from Pink Floyd, it is short, sharp shocks of knowledge ingested. They won’t sit down and read 50 pages of a textbook.” Sophisticated learning programs are one way to keep this generation engaged. “Millennials will be an increasing challenge for companies to attract and retain because of their high expectations,” says Bastian. “They’re not interested just in money but also in a career path and the opportunity for diverse experiences.”

It’s risky to assume that your business isn’t in a prime spot for disruption (see “Corporate Learning Trends”). Companies will need to adapt or suffer the consequence of a disengaged and unprepared workforce. An Oxford Economics Workforce 2020 survey found that the top concern of employees is the risk of becoming obsolete; nearly 40% of North American respondents said that their current skills will not be adequate in three years, and only 41% of global respondents said that their companies are giving them opportunities to develop new skills.

Corporate Learning Trends

  • Nearly 40% of North American respondents said that their current job skills will not be adequate in three years, with the majority agreeing that the need for technology skills, especially in analytics and programming, will grow.
  • Less than half (47%) of executives say they have a culture of continuous learning. A similar percentage says that trouble finding employees with base-level skills is affecting their workforce strategy.
  • Spending on technology education in the Americas will have a compound annual growth rate (CAGR) of4.2% from 2014 to 2019, with the highest growth in the United States for collaborative applications (11.9% CAGR), followed by data management applications (7.8%).
  • The global e-learning market was worth US$24 billion in 2013, with predicted growth of $31.6 billion by 2018.
  • Of the $31.6 billion predicted worldwide spend on corporate e-learning by 2018, $22.5 billion will be on content.
  • A majority of chief learning officers (57%) say that learning technology is a significant priority for spending.
  • In 2014, 32.6% of training was delivered through e-learning (asynchronous and synchronous); 30.4% took place in the classroom, 18.9% was on the job, and 18.1% was “other,” which includes video and text.
  • E-learning is the preferred method for developing IT skills, said 34% of participants, compared with 29.2% for classroom training. For developing business skills, an overwhelming 57.3% chose classroom training.

Evolution of learning: personal, social, mobile, and continuous 

SAP_Learning-Isbell_INQUIRY_image2400x1600_3Online courses have become a standard way to gain knowledge, and that’s shifting to even more interactive learning through mobile, which is available anywhere and anytime. Like many large companies, SAP had created a vast library over time of more than 50,000 training assets, which was cumbersome to navigate and manage. The curriculum was organized across regions, lines of business, and disciplines. As a result, mapping learning to broader business goals was difficult.

To modernize its learning environment, SAP deployed a cloud-based learning management system and a social collaboration tool. Today, more than 74,000 employees can create personalized training through a combination of online self-study that incorporates video and documentation, social learning tools for exchanging ideas with other employees, and hands-on practice using SAP applications in a sandbox environment.

Now the company is engaging four times more employees in learning activities than it did with the older on-premise learning management system (LMS). The new approach is also creating between €35 million and €45 million in increased operating profit with just a 1% increase in engagement. Administrative costs have decreased by €600 per new content item added. Managers and employees alike can create and access learning paths much more easily and track progress from their personal pages. This integrated, simple-to-use online-learning approach is an example of how learning departments need to evolve to stay relevant.

There are several characteristics of digital learning transformation:

  • Micro-learning. The concept of breaking lessons into smaller bites minimizes productivity disruptions and mirrors consumer behavior of watching three-minute videos and reading social media to get information on anything under the sun. Micro-learning is perfect for learning how to write a business plan, develop code in Ruby on Rails, or learn about a manufacturer’s latest appliance before a service call, for example. It can mean segmenting a longer course into small lessons, which the employee could view over lunch or in the evening from home. Several Alteris clients are now looking to deploy mobile learning apps, ideal for micro-learning, as the main delivery platform, says Bastian. These apps work best when integrated with the LMS and HR systems and push relevant material to users based on their learning profile.
  • Self-serve learning. Just-in-time learning is critical when learning needs accelerate. Companies can help by providing continually updated tools and content that can be accessed from any device, at the moment of need. It’s the best way for learning departments to keep up with employees’ needs; you can schedule only so many Webinars and classroom training courses.
  • Learning as entertainment. Gamification has been hot in marketing for a few years and is also a viable tool for corporate learning. New employees at Canadian telecommunications company TELUS earn badges as they complete different orientation tasks, such as creating a profile on the corporate social network. Leaders can spend eight weeks coaching a virtual Olympic speed-skating team, competing against colleagues to earn gold medals. Winning requires demonstrating the leadership behaviors that TELUS values.Training is also starting to incorporate virtual reality. For example, the U.S. military is using a gaming platform that incorporates avatars to create simulations that train soldiers to deal with dangerous or problematic situations. “This is more immersive and has the potential to help with the human connection failings of online learning,” says Joe Carella, managing director of executive education at the University of Arizona. Regardless of the method, adding an element of fun and recognition for reaching milestones is important for capturing the attention of younger workers who have grown up on games and apps.
  • Social learning. Learning is an emotional experience and most people don’t want to be alone when they learn. In that regard, social media models can be profoundly valuable because they foster sharing and collaboration, which helps employees retain the knowledge they gain through formal training programs. That’s why social collaboration platforms have become as important to the overall learning strategy as the specific types of training delivery methods themselves.
  • User-generated content. A common theme spanning all of the previously mentioned areas has played out in mainstream media and social media over the past few years. “What learners value the most today is the raw, user-created content over the highly polished corporate-created content,” says Elliott Masie, founder of The MASIE Center, a think tank focused on learning and knowledge in the workforce. “What’s really fascinating is that this trend is creating a town-square model where learners are ripe to learn from others.”
  • Video. “Almost anyone can produce a training video, and it’s technically more convenient than ever before,” says Cushing Anderson, a VP and analyst focusing on HR and learning at IDC. “Digital learning is often about substituting convenience for perfect quality.”

Universities and MOOCs: What We’ve Learned So Far

Degrees and certifications have been going online through massive open online courses (MOOCs) for a few years, reflecting the changing needs of students as well as the escalating costs of traditional education.

Threatened with disruption from independent MOOC startups such as Coursera and Udacity, universities and colleges have scrambled to keep pace. More than 80% now offer several courses online and more than half offer a significant number of courses online, according to the EDUCAUSE Center for Analysis and Research. The survey found that more than two-thirds of academic leaders believe that online learning is critical to the long-term strategic mission of their institutions.

MOOCs have delivered a transformation of higher learning that wasn’t possible a decade ago, when access to a Harvard professor was available only to the elite few who had earned their place in those hallowed halls and who could afford the stratospheric tuition.

However, MOOCs have not been proven out yet as an effective replacement for traditional degrees, much less the acquisition of knowledge. Completion rates for courses are low, and MOOCs so far seem best suited for technical or tactical topics or as a supplement to the classroom, observes Joe Carella, managing director of executive education at the University of Arizona.

Yet MOOCs are playing a growing role in companies. Getting access to real business experts, such as a well-known speaker like Jim Collins, is especially valuable for a small or midsize business that couldn’t afford to hire that individual otherwise.

Making the shift

For decades, corporate learning departments have delivered education through a fairly narrow, top-down funnel: curriculum is designed months ahead of time and learning paths are structured for targeted roles in the organization. In moving toward accelerated, continuous learning, chief learning officers will need to help foster a culture of accountability and excitement around learning, as follows:

  • SAP_Learning-Isbell_INQUIRY_image1600x2400_1Develop a close alignment between learning departments and senior business leaders to understand skill gaps, customer needs, and employee shortfalls.
  • Become a content curator and take on a customer service role in the business.
  • Ensure that learning is specific to the individual and relates to specific business and career goals.
  • Have managers help by motivating and guiding employees through the tools, helping them develop personalized plans, and monitoring their progress.

In most cases, companies should be relatively hands-off when it comes to employee learning, says Eilif Trondsen, director of learning, innovation, and virtual technologies at Strategic Business Insights. “It is the responsibility of the workers to learn and acquire the needed skills and competencies for their jobs,” says Trondsen, “and it’s important to monitor the outcomes and not micromanage the process they use for getting there.”

However, it’s important that leaders motivate employees to learn by setting a good example. At TELUS, a company vice president started an internal online community and his own blog to share information about working in his division. The company views corporate learning not as curriculum but as a set of experiences, including classroom courses, online training, coaching, mentoring, and informal collaboration. TELUS measures the direct impact of learning through surveys of both employees and their managers. One metric reports on the learning tools that are most effective for acquiring different types of knowledge, while another measures return on performance from a specific learning program.

Measuring learning effectiveness is a difficult key performance indicator, just as customer engagement is, yet digital learning platforms often have built-in analytics to create a starting point. The analytics allows companies to run reports on usage to see what’s most effective and to retire those assets that aren’t being used. Ultimately, companies should work toward connecting the dots between learning outcomes and business outcomes, such as attrition, employee engagement, and sales growth.

The human equation of digital learning

Today and into the future, no matter the technology or method deployed, excellent learning depends on excellent instructors. They must have credibility with their audiences or the program will flop. For example, when Sun Microsystems (now owned by Oracle) first offered e-learning on its programming language, Java, customers balked because they wanted to know who the expert behind the course was, just like in a classroom. So Sun included a video introduction by the original developer of Java, James Gosling, and the program took off.

Another caution with digital learning is that it can never replace the five senses one gets in a physical setting and lacks spontaneity. “With e-learning, you can pause the course whenever you wish, but sometimes breakthroughs happen when you are out of your comfort zone and challenged,” Carella says. A discussion can merge into a novel direction in ways that don’t typically happen when people are chatting online. Ideally, online learning should be interspersed with in-person educational experiences, whether that’s attending a classroom training or meeting with a mentor.

Blending formal and informal training, as well as offline and online training, is a historical trend that will continue, says Masie, who also leads The Learning CONSORTIUM, a coalition of 230 global organizations, including CNN, Walmart, Starbucks, and American Express. Incorporating multiple modes of learning is critically important for gaining knowledge that sticks.

“A learner who isn’t motivated will sit in front of the screen and complete a course but may never actually develop the skill,” he says. To close the loop, managers and learning departments can develop a process that includes practice, feedback, and on-the-job experience.

SAP_Learning-Isbell_INQUIRY_image2400x1600_1The long-term goal of digital learning: grow the business

As executives consider how learning and training should evolve, a grounding consideration is the level of commitment. Few companies spend enough on it, says IDC’s Anderson. Those with world-class training programs can gain an edge in hiring and possibly even in the market. Introducing innovative learning tools and programs that allow employees to study independently and experiment with new ideas is also motivating, which can lead to higher engagement, productivity gains, and even bottom-line benefits. In fact, says Masie, research has shown that organizations that invest at least 3% of income on learning have better stock performance and employee retention.

Highest ROI in e-commerce? Email remarketing and retargeted ads

person-checking-email-smartphone-image-930x370

Digital marketers know they must measure and optimize all of their efforts, with the goal of increasing sales. They must also be able to prove a positive return on their investments. That said, digital marketers are constantly on the hunt for the latest technologies to help with both.

Shopping Cart Abandonment Emails Report Highest ROI

The highest ROI reported is from shopping cart abandonment emails. This shouldn’t be a surprise — 72 percent of site visitors that place items into an online shopping cart don’t make the purchase. Since they did almost purchase, cart abandoners are now your best prospects. And, a sequence of carefully timed emails will recover between 10-30 percent of them.

It’s these types of recovery rates that propel shopping cart abandonment emails to the top. They generate millions in incremental revenue for only a small effort and cost.

Retargeted Ads Complement Shopping Cart Abandonment Emails

The second most successful technique is retargeted advertising, a fantastic complement to shopping cart abandonment emails. Retargeted advertising works in a similar way, by nudging visitors to return to a website after they have left. And while retargeted advertising works across the entire funnel — from landing to purchase — the biggest opportunities lie where there is some level of intent to purchase, such as browsing category and product pages.

While the two techniques deliver a high ROI, they are definitely not the same. For example, brands using SeeWhy’s Conversion Manager to engage their shopping cart recovery emails average a 46 percent open rate and 15 percent click-through rate. Retargeted ads, by comparison, average a 0.3 percent click-through rate.

See the difference?

The real power comes when you combine the two techniques together — using retargeted advertising when no email address has been captured and email remarketing when it has.

Don’t “Set ‘Em and Forget ‘Em”

To achieve the highest possible ROI combining cart abandonment emails with retargeted advertising, you should plan to test and tune your campaigns. It’s dangerous to go live with your new campaign and then ‘set it and forget it.’ Testing and tuning your campaign can double or triple your revenues. SeeWhy tracks more than $1B in Gross Market Value ecommerce revenues annually and analyzes this data to understand what factors have the biggest impact on conversion.

A SeeWhy study of more than 650,000 individual ecommerce transactions last year concluded that the optimal time for remarketing is immediately following abandonment. Of those visitors that don’t buy, 72 percent will return and purchase within the first 12 hours.

So timing is one of the critical factors; waiting 24 hours or more means that you’re missing at least 3 out of 4 of your opportunities to drive conversions. For example, a shopping cart recovery email campaign sent by Brand A 24 hours after abandonment may be its top performing campaign. But this campaign delivers half the return of Brand B’s equivalent campaign which is real time.

Scores of new technologies and techniques will clamor for your attention, making bold claims about their ROI and conversion. But if they aren’t capable of combining shopping cart abandonment emails and retargeted ads, the two biggest ROI drivers in the industry, then they aren’t worth your time.

@JovieSylvia @ITChamps_SAP

Take a look at our website: www.itchamps.com

What Engaged And Disengaged Companies Do Differently

When there’s something you want to improve about your organization and its workforce, it’s only natural to look to the companies that are doing it right. And when it comes to employee feedback, that means looking to today’s most highly engaged companies.

The info-graphic below — created by Quantum Workplace, a company dedicated to providing every organization with quality engagement tools that guide their next step in making work better every day — narrows in on what engaged and disengaged companies do differently when it comes to one of the most important aspects of employee engagement: feedback. Some highlights include:

  • Employee engagement is important to leadership at 90 percent of highly engaged companies, compared to only 20 percent of disengaged companies.
  • Employee engagement is a year-round initiative for 78 percent of highly engaged companies, compared to only 30 percent of disengaged companies.
  • Disengaged companies are 15 times more likely to never have administered an employee survey, compared to highly engaged companies.
  • Highly engaged companies report seeing a higher percent of employees participating in their employee surveys (60 percent vs. 20 percent).

Check out the full info-graphic below to find out the main communication differences between engaged and disengaged companies — and what it means for your organization.

QW-InfographicMostEngaged_972px

Visit to www.itchamps.com to know more

Know More: marketing@itchamps.com

Our Digital Planet: Rise of The Digital Worker The New Breed of Worker

image05-730x300

British-Australian mining giant Rio Tinto has employed autonomous trucks, excavators and drills recently to create the first workerless iron ore mine in Western Australia. The drivers – if they can still be called that – work out of a remote operations centre hundreds of kilometres away, where data scientists mine data collected from the vehicle’s sensors. This dynamic, known as the ‘human and digital recombination’, is but a single step on the path to a changed workplace, as connectivity and automation drive the transition to digital on an unprecedented scale.

digital_planet_02_image1Real-time analysis, together with emerging digital technologies and intelligent digital processes, have upended the workplace as we know it; and businesses are today subject to a deep cultural shift in work organisation, culture and management mind set. The impact is a shift towards workers looking at available information as opposed to ‘explorative surgery’ measures when the damage is already done.

Human and digital recombination, cutting-edge decision making, realtime adaptation and experiment-driven design are pushing this transformation, not just in manufacturing but in every conceivable area of the workplace. And while the technology has done much to facilitate the transition to digital, the challenges are many.

Fat tags

Aside from Rio Tinto’s automated vehicles, other software-enabled, manufacturing- friendly marvels are around the corner, such as kilobyte-rich radio frequency identification (RFID) tags. Basically position finders at present, tomorrow’s tags will have so much storage capacity that they will act like transponders and actually tell people what to do.

As Siemens’ Markus Weinlander, Head of Product Management, predicted: “[RFID tags] can make a major contribution to the realisation of Industry 4.0 by acting as the eyes and ears of IT. For the first time, transponders will be able to carry additional information such as the production requirements together with their assembly plan. All of this will be readable at relatively large distances.”

These ‘fat tags’ will do more than boost automation. They will also make companies more nimble-footed and, say experts, allow small businesses to compete with the giants. According to Weinlander, the new wave of RFID rags will greatly facilitate customised products because they will contain all the essential information for small runs. “To remain competitive in today’s global market environment, many companies have to be able to produce in tiny batches without higher costs”, he said.

Other practical benefits are likely. For instance, maintenance and repair work will be made simpler, faster and more timely. As BCG Consulting points out, technicians will identify any problems with a machine from a stream of realtime data and then make repairs with the help of augmented-reality technology supplemented, if necessary, by remote guidance from off-site experts. In this way, downtime per machine will be reduced from one day to an hour or two.

digital_planet_02_image2

Digital people

In this brave new world of hyperconnectivity, the ‘digital worker’ – a data-driven individual skilled in converting information into revenue – will stand in the middle and direct traffic, as it were. As SAP put it in its D!gitalistmagazine, the digital worker will “create instant value from the vast array of real-time data.”

Instead of the traditional approach of gathering, processing, and moving data around while spending valuable time creating reports, digital workers will be forced to move towards predictive, scenario, and prognosis-based decision- making. SAP’s article goes on to explain: “The speed of information and data is driving such significant change in how and where we work that the digital worker is becoming a critical resource in decision-making, learning, productivity, and overall management of companies.”

HYPERCONNECTIVITY HAS LED US TO A NEW ERA, WHERE PETER DRUCKER’S “KNOWLEDGE WORKER” HAS COME TO AN END AND THE “DIGITAL WORKER” NOW NEEDS TO STEP UP AND CREATE INSTANT VALUE FROM THE VAST ARRAY OF REAL-TIME DATA

In organisations where data-savvy individuals may know more about what’s happening than the boss, the top-down hierarchy will be overturned. In short, everybody will be a leader in their own particular area of expertise. “The traditional management and organisational model is quickly getting outdated in the digital economy, and true leaders are changing their management approach to reflect this”, said SAP. Senior executives will have to be more visible and approachable for employees and customers alike – in short, both colleague and captain.

“[Managers] must juggle a distributed contingent workforce with digital workers who require real-time analysis, prognosis, and decision making. At the same time, they must develop the next generation of leaders who will actively take responsibility for innovation and engagement”, said SAP.

If done properly, this new collaborative workplace could reduce the complexity that bedevils most large organisations in an era of globalisation. According to the Economist Intelligence Unit, 55 percent of executives believe their organisational structure is ‘extremely’ or ‘very’ complex and 22 percent say they spend more than a quarter of their day managing complexity. More than three-quarters say they could boost productivity by at least 11 percent if they could cut complexity by half.

More jobs

But will the superconnected workplace destroy jobs? BCG Consulting thinks not. In a study of German manufacturing released in October, the think tank concluded that higher productivity actually equals higher employment at home. “As production becomes more capital intensive, the labour cost advantages of traditional low-cost locations will shrink, making it attractive for manufacturers to bring previously off-shored jobs back home”, the study predicted. “The adoption of Industry 4.0 will also allow manufacturers to create new jobs to meet the higher demand resulting from the growth of existing markets and the introduction of new products and services.”

Experts such as Ingo Ruhmann, Special Adviser on IT systems at Germany’s Federal Ministry of Education and Research, agree with this finding. “Complete automation is not realistic”, he told BCG Perspectives. “Technology will mainly increase productivity through physical and digital assistance systems, not the replacement of human labour.”

However, it will be a new kind of human labour. “The number of physically demanding or routine jobs will decrease while the number of jobs requiring flexible responses, problem solving, and customisation will increase”, Ruhmann predicts. For most employees, tomorrow’s workplace should be a lot more fun.

How Big Data is changing e-commerce for good

man-using-tablet-in-data-center-image-930x370

You’re going to have to get used to it: data is everywhere, we contribute to it constantly, and it has a huge impact on the retail industry. In fact, 80-90 percent  of all the data in the world was created in just the last two years.Big data is generally portrayed as having all the solutions to many of the biggest issues in retail (as long as it is mined and utilized correctly), but it still has a lot of quirks to work out.

A big chunk of the problem with big data comes down to how it’s defined. There are dozens of different takes on it, but let’s discuss it as the rapid increase of the creation of diverse and quickly transforming data through multiple channels that must be processed in innovative and strategic ways.

Global retail sales should reach $3 trillion this year, and big data has the potential to unlock a larger slice of the market share pie for retailers. How? Well, that’s the interesting part.

How Big Data Helps

Since it is defined so broadly, big data encompasses many types of information that are useful to retailers, both online and in-store. They say that you don’t know until you mine and that couldn’t be more true. We’ve all heard about the beer and diapers example in which Walmart learned that the two products were often bought together after analyzing data from in-store purchases. Retailers have many insights to gain from their customers’ purchasing habits, such as when shoppers buy the most, what they buy together, and which offers are most effective.

Retailers understand that they need data to win, as 59 percent identified a lack of consumer insights as their top data-related pain point. Big box retailers are already benefiting from big data. Walmart creates 1 million rows of transaction records each hour from a combination of in-store purchases, social data, and more. This gives the retailer access to massive customer insights to help target customers and merchandise more effectively.

How to Use Big Data

In the ever-changing world of retail, staying up-to-date is a challenge and a necessity. The top three things that retailers need to know are: how effective their pricing is, when shoppers are most active, and what items they buy together. These three key insights can be derived from big data, but consistent mining is the only way to really enjoy the benefits. I’ll break these down into pricing and shopping behavior to explore big data’s impact on each.

Pricing: Do you know the optimal price for each of your products? Unless you’re psychic, you will need to test slightly different prices to determine which one provides the sales and profit margins. Not all retailers are able to price perfectly the first time around and that “perfect” price rarely stays the same. A bathing suit in June will sell at a higher price than in December. Forecast demand based on historical sales data and price according to variables, such as seasonality and competitor prices.

Shopper behavior: Demand tends to peak during the evening and on the weekend. Retailers can alter pricing based on traffic and conversions to maximize sales and profit. Say it’s the end of the season and the retailer wants to make room in their warehouse for the upcoming season’s styles. Dropping prices when traffic is high will help products move.

On the other hand, raising prices slightly when demand is high will help pull in more profit margin from each sale. Similarly, promoting products that shoppers often buy together can boost your average order value and help products move more quickly. Automatically bundling these products can be a time-saver for busy shoppers and encourage them to buy by showing that getting all the items together is cheaper than buying them separately. Increase average order value while building loyalty.

Big data isn’t a new concept, but it is a resource to tap into sooner rather than later. All of the answers you need are there in front of you, it’s just a matter of crunching the numbers. The insights that big data offers can take your retail business from zero to 60 in no time. Mining, analyzing, and acting on data is the only way to make informed decisions to ensure the success of your retail business.

How have you used big data and what impact have you seen?

Prepare yourself—and your brand—for the creator economy

paintbrushes

When Henry Ford introduced the first assembly line for manufacturing the Model T, the price of a car dropped to $265 by 1925. This lower price threshold eliminated barriers to purchase for the average worker and signaled the start of the Industrial Era.

Industrial production became so efficient suddenly that companies found themselves in the position of needing to create demand. This demand-creation model ushered in the era of what was known as the consumer economy and the domination of mass media as a marketing tool.Consumers were suddenly bombarded with messages urging them to fill their lives and their homes with all manner of goods.

After the financial crash of 2008, Millennials, who grew up turning off the TV and ignoring web advertising, began to dominate the economy. Mass media found itself competing with social networks like YouTube, Facebook, and Twitter.

Modern consumers are savvy and highly engaged, and the demand personal attention and stellar experiences. They refuse to be passive “consumers” and actively seek out engagement, from editing Wikipedia entries, to sharing customer-service highs-and lows-on their social networks, and beyond this going for peer-to-peer services sharing their houses, cars, households items or leaving their dogs for a week-end to a host.

Welcome to the Creator Economy. Here are five guiding principles for this new era.

No 1: Change the Customer Relationship

Instead of keeping the customer under control, companies should embrace the paradox that the best way to retain customers is to set them free. They should engage with the customer on a one-to-one basis while bearing in mind that every point of engagement matters.

Each act of engagement, whether it’s a tweet, a click, a location check-in, and an IoT sensor reading can be used to not only optimize the customer experience in real-time, but to create the fundamental business value that drives business models in the creator economy. It’s all about engaging with the customer by sharing relevant content based on real-time context.

No 2: Change the Partner Relationship

The go-to-market strategy has to evolve from a traditional linear process to a multi-sided business model where transacting business with, through and on behalf-of third parties is key to the success of the business model.

Third parties see great value in those established customer relationships and recognize the service provider as a potential distribution channel for their own service offerings. For the service provider, this creates a virtuous circle inherent to the multi-sided platform opportunities. The value for end customers grows with combined offerings, customer loyalty increases, the customer base is broadened and consequently attracts more partners.

No. 3: Disrupt your own revenue models

Companies are transitioning from selling products to selling a personalized service, a specific experience or a negotiated outcome. While we are more familiar with subscriptions within the software industry, we see this model now arising in the manufacturing space with brands like Rolls Royce, Hilti, Lexmark, and even x-ray machines.

Selling an outcome becomes a new way of engaging with a customer. Rather than measuring the service delivered, instead the focus will be on gauging the actual business benefit. This requires companies to structure their business models to operate not based on what they can package, sell and measure, but rather based on what downstream benefits are generated and how much they contributed to that outcome. The focus must be on value, not revenue.

No. 4: Plan and build a secure, scalable infrastructure

Growth strategies will have implications that you have to take into consideration when considering your delivery process. Be prepared for:

  • Smooth and efficient expansion in new regions where currencies will be different, and payment habits will differ as well: improving local payments such as introducing invoicing rather than cash on delivery can be key to increase the check-out conversion rate.
  • Managing high volumes of customers and transactions that will grow by multiple orders of magnitude when moving from product to service.

No. 5: Agility should be part of your DNA

While constant efficiency improvements are a prerequisite for a healthy bottom line, it is no longer sufficient in the creator-economy landscape, which is an iterative and rapidly changing economy.

Companies have to go for simplicity, provide autonomy and embed intelligence directly into the production and business processes to help them adapt quickly to changing needs. Simplicity can take the form of a cloud delivery model, autonomy can translate into micro-services and APis to add/build new functionalities through a community of solution providers, and intelligence can be called sensors, analytics, predictive capabilities, and in memory database.

These five steps should set you on the way to become customer experience leaders in this creator-economy era.

Identifying Performance Problems in ABAP Applications

SAP-ABAP-training

Analyze Statistics Records Using the Performance Monitor (Transaction STATS)

IT landscapes tend to become more complex over time as business needs evolve and new software solutions for meeting these needs emerge. This complexity can become a challenge for maintaining smooth-running business operations and for ensuring the performance and scalability of applications.

Performance means different things to different people. End users demand a reasonable response time when completing a task within a business process. IT administrators focus on achieving the required throughput while staying within their budget, and on ensuring scalability, so that a software’s resource consumption changes predictably with its load (the number of concurrent users or parallel jobs, or the number or size of processed business objects, for example). For management, optimal performance is about more productive employees and lower costs.

The overall objective is to reach the best compromise between these perspectives. This requires reliable application monitoring data, so that developers or operators can analyze an application’s response time and resource consumption, compare them with expectations, and identify potential problems. SAP customers running SAP NetWeaver Application Server (SAP NetWeaver AS) ABAP 7.4 or higher can access this data with a new, simple, user-friendly tool: the Performance Monitor (transaction STATS).

This article provides an introduction to the statistics records that contain this monitoring data for applications that run on the ABAP stack, and explains how you can use transaction STATS to analyze these records and gain the insights you need to identify applications’ performance issues.

What Are Statistics Records?

Statistics records are logs of activities performed in SAP NetWeaver AS ABAP. During the execution of any task (such as a dialog step, a background job, or an update task) by a work process in an ABAP instance, the SAP kernel automatically collects header information to identify the task, and captures various measurements, such as the task’s response time and total memory consumption. When the task ends, the gathered data is combined into a corresponding statistics record. These records are stored chronologically — initially in a memory buffer shared by all work processes of SAP NetWeaver AS ABAP. When the buffer is full, its content is flushed to a file in the application server’s file system. The collection of these statistics records is a technical feature of the ABAP runtime environment and requires no manual effort during the development or operation of an application.

The measurements in these records provide useful insights into the performance and resource consumption of the application whose execution triggered the records’ capture, including how the response times of the associated tasks are distributed over the involved components, such as the database, ABAP processing (CPU), remote function calls (RFCs), or GUI communication. A detailed analysis of this information helps developers or operators determine the next steps in the application’s performance assessment (such as the use of additional analysis tools for more targeted investigation), and identify potential optimization approaches (tuning SQL statements or optimizing ABAP coding, for example). In addition to performance monitoring, the statistics records can be used to assess the system’s health, to evaluate load tests, and to provide the basis for benchmarks and sizing calculations.

Productive SAP systems process thousands of tasks each second and create a corresponding number of statistics records, which contain valuable measurements for identifying performance issues. While existing tools provide access to the data in these records, transaction STATS offers an enhanced user interface that makes it much easier for you to select, display, and evaluate the data in statistics records, and devise a targeted plan for optimization.

Ensuring the Validity of Your Measurements

The value of a performance analysis depends on the quality of the underlying measurements. While the collection of data into the statistics records is performed autonomously by the SAP kernel, some preparatory actions are needed to ensure that the captured information accurately reflects the performance of the application.

The test scenario to be executed by the application must be set up carefully; otherwise, the scenario will not adequately represent the application’s behavior in production and will not yield the insights you need to identify the application’s performance problems. A set of test data that is representative of your productive data must be available to execute the scenario in a way that resembles everyday use. The test system you will use for the measurements must be configured and customized correctly — for example, the hardware sizing must be sufficient and the software parameterization must be appropriate, so that the system can handle the load. To obtain reliable data, you must also ensure that the test system is not under high load from concurrently running processes — for example, users should coordinate their test activities to make sure there are no negative interferences during the test run.

You must then execute the scenario a few times in the test system to fill the buffers and caches of all the involved components, such as the database cache, the application server’s table buffer, and the web browser cache. Otherwise, the measurements in the statistics records will not be reproducible, and will be impaired by one-off effects that load data into these buffers and caches. This will make it much more difficult to draw reliable conclusions — for example, buffer loads trigger requests to the database that are significantly slower than getting the data out of the buffer, and that increase the amount of transferred data. After these initial runs, you can execute the measurement run, during which the SAP kernel writes the statistics records that you will use for the analysis.

Displaying the Statistics Records

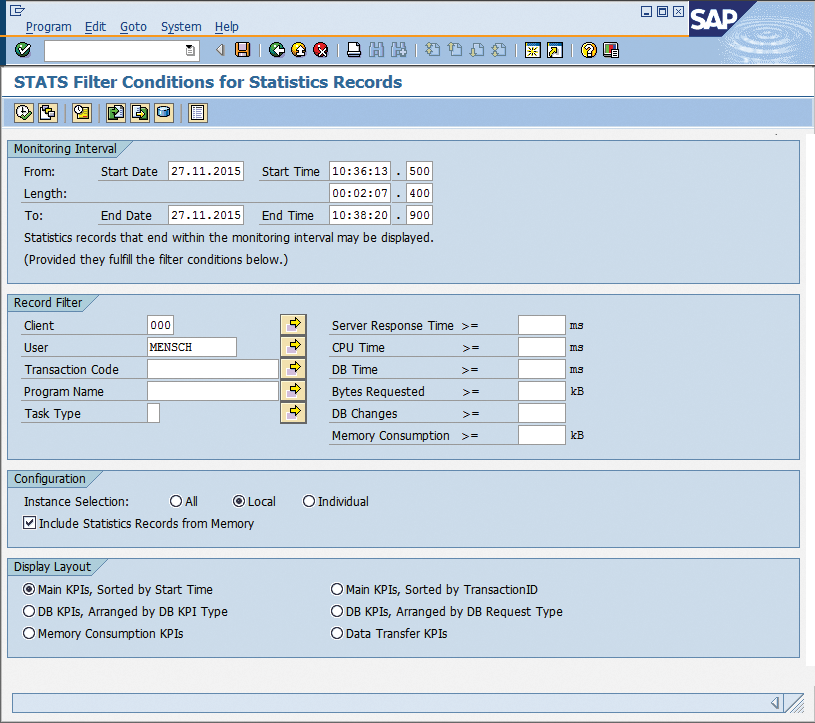
To display the statistics records that belong to the measurement run, call transaction STATS. Its start screen (see Figure 1) consists of four areas, where you specify criteria for the subset of statistics records you want to view and analyze.

 FIG 1
Figure 1 — On the STATS start screen, define filter conditions for the subset of statistics records you want to analyze, specify from where the records are retrieved, and select the layout of the data display

In the topmost area, you determine the Monitoring Interval. By default, it extends 10 minutes into the past and 1 minute into the future. Records written during this period of time are displayed if they fulfill the conditions specified in the other areas of the start screen. Adjust this interval based on the start and end times of the measurement run so that STATS shows as few unrelated records as possible.

In the Record Filter area, you define additional criteria that the records to be analyzed must meet — for example, client, user, or lower thresholds for measurement data, such as response time or memory consumption. Be as specific and restrictive as possible, so that only records relevant for your investigation will be displayed.

By default, statistics records are read from all application instances of the system. In the Configurationsection, you can change this to the local instance, or to any subset of instances within the current system. Restricting the statistics records retrieval to the instance (or instances) where the application was executed shortens the runtime of STATS. The Include Statistics Records from Memory option is selected by default, so that STATS will also process records that have not yet been flushed from the memory buffer into the file system.

Under Display Layout, select the resource you want to focus on and how the associated subset of key performance indicators (KPIs) — that is, the captured data — will be arranged in the tabular display of statistics records. The Main KPIs layouts provide an initial overview that contains the most important data and is a good starting point.

Analyzing Selected Statistics Records

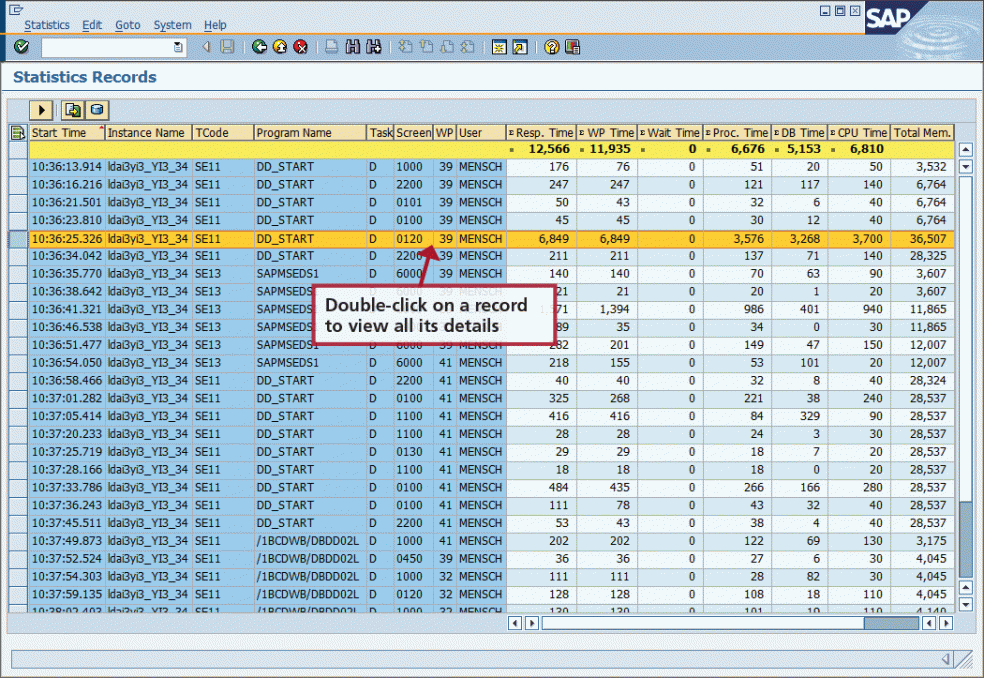
Figure 2 shows the statistics record display based on the settings specified in the STATS start screen. The table lists the selected statistics records in chronological order and contains their main KPIs.

FIG 2arge

The header columns — shown with a blue background — uniquely link each record to the corresponding task that was executed by the work process. The data columns contain the KPIs that indicate the performance and resource consumption of the tasks. Measurements for times are given in milliseconds (ms) and memory consumption and data transfer are measured in kilobytes (KB).

The table of statistics records is displayed within an ALV grid control and inherits all functions of this well-known SAP GUI tool: You can sort or filter records; rearrange, include, or exclude columns; calculate totals and subtotals; or export the entire list. You can also switch to another display layout or modify the one you have chosen on the start screen. To access these and other standard functions, expand the toolbar by clicking on the Show Standard ALV Functions (Show Standard ALV Functions button) button.

The measurements most relevant for assessing performance and resource consumption are the task’sResponse Time and Total Memory Consumption. The Response Time measurement starts on the application instance when the request enters the dispatcher queue and ends when the response is returned. It does not include navigation or rendering times on the front end, or network times for data transfers between the front end and the back end. It is strictly server Response Time; the end-to-end response time experienced by the application’s user may be significantly longer. The most important contributors to serverResponse Time are Processing Time (the time it takes for the task’s ABAP statements to be handled in the work process) and DB Request Time (the time that elapses while database requests triggered by the application are processed). In most cases, Total Memory Consumption is identical to the Extended Memory Consumption, but Roll Memory, Paging Memory, or Heap Memory may also contribute to the total.

Since even the most basic statistics record contains too much data to include in a tabular display, STATS enables you to access all measurements — most notably the breakdowns of the total server Response Timeand the DB Request Time, and the individual contributions to Total Memory Consumption — of a certain record by double-clicking on any of its columns. This leads to an itemized view of the record’s measurements in a pop-up window, as shown in Figure 3. At the top, it identifies the particular statistics record via its header data. The up and down triangles (up navigation button and down navigation button) to the left of the header data support record-to-record navigation within this pop-up. The available technical data is grouped into categories, such as Time, DB, andMemory and Data. Use the tabs to navigate between categories containing data. Tabs for categories without data for the current statistics record are inactive and grayed out.

01-2016-PDMC-fig3-large

To assess the data captured in a statistics record, consider the purpose that the corresponding task serves. OLTP applications usually spend about one fourth of their server Response Time as DB Request Time and the remainder as Processing Time on the application server. For tasks that invoke synchronous RFCs or communication with SAP GUI controls on the front end, associated Roll Wait Time may also contribute significantly to server Response Time. For OLTP applications, the typical order of magnitude for Total Memory Consumption is 10,000 KB. Records that show significant upward deviations may indicate a performance problem in the application, and should be analyzed carefully using dedicated analysis tools such as transaction ST05 (Performance Trace). In comparison, OLAP applications usually create more load on the database (absolute as well as relative) and may consume more memory on the application server.

Saving Statistics

As mentioned earlier, productive systems create statistics records with a very high frequency, leading to a large volume of data that has to be stored in the application server’s file system. To limit the required storage space, the SAP kernel reorganizes statistics records that are older than the number of hours set by the profile parameter stat/max_files and aggregates them into a database table. After the reorganization, STATS can no longer display these records.

If you need to keep statistics — that is, a set of statistics records that match conditions specified on the STATS start screen — for a longer period of time for documentation reasons, reporting purposes, or before-after comparisons, you have two options:

  • Export the statistics to a binary file on your front-end PC
  • Save them into the statistics directory on the database

Both options are available via the corresponding Export Statistics to Local Front End button and Save Statistics to Database button buttons, respectively, on the STATS start screen (Figure 1) and in the tabular display of the statistics records (Figure 2).

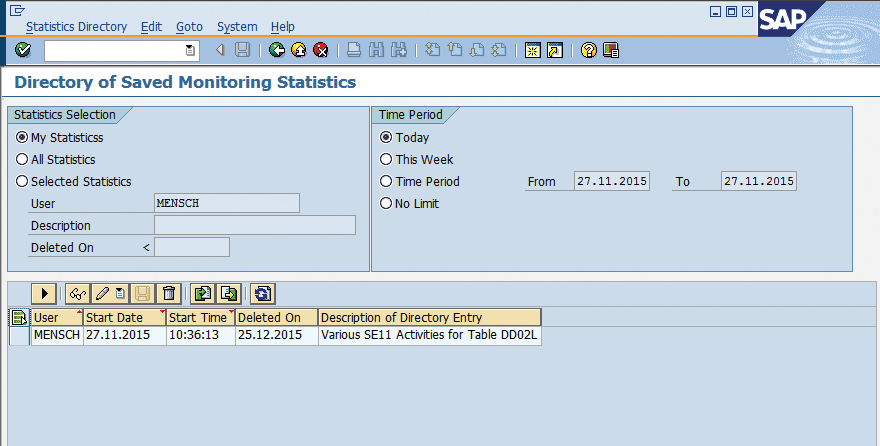
To access and manage the statistics that were saved on the database, click on the Show Statistics Directory button button on the STATS start screen (Figure 1), which takes you to the statistics directory shown in Figure 4. In the two areas at the top of the screen, you specify conditions that the statistics must fulfill to be included in the list displayed in the lower part of the screen. Statistics are deleted automatically from the database four weeks after they have been saved. You can adjust this default Deleted On date so that the data is still available when you need it. Similarly, you can change the description, which you specified when the statistics were saved. Double-clicking on a row in the directory displays the corresponding set of statistics records, as shown in Figure 2. All capabilities described previously are available.

FIG $

Statistics that were exported to the front-end PC can be imported either into the STATS start screen, which presents the content in the tabular display shown in Figure 2, or into the statistics directory, which persists it into the database. In both cases, the import function is accessed by clicking on the Import Statistics from Local Front End button button. You can also import statistics into an SAP system that is different from the system where the statistics were exported. This enables the analysis of statistics originating from a system that is no longer accessible, or cross-system comparisons of two statistics.

Conclusion

To optimize the performance of applications and ensure their linear scalability, you need reliable data that indicates the software’s response times and resource consumption. Within the ABAP stack of SAP solutions, this data is contained in the statistics records that the SAP kernel captures automatically for every task handled by a work process. Using this information, you can identify critical steps in an application, understand which component is the bottleneck, and determine the best approach for optimization.

The Performance Monitor (transaction STATS) is a new tool available with SAP NetWeaver 7.4 for selecting, displaying, and analyzing statistics records. It helps developers and operators find the best balance between fast response times, large data throughput, high concurrency, and low hardware cost. The tool is easy and convenient to use, and employs a feature-rich UI framework so that you can focus on the data and its interpretation, and set a course for high-performing applications.

Internet of Things & Marketing

by @Raghavendra Deshpande – Business Development Expert

5 Ways the Internet of Things Will Make Marketing Smarter

IoT

The Internet of Things (IoT) is a real technological revolution that will impact everything we do. It’s a gigantic wave of new possibility that is destined to change the face of technology as we know it.

IoT is the interconnectivity between things using wireless communication technology (each with their own unique identifiers) to connect objects, locations, animals, or people to the internet, thus allowing for the direct transmission of and seamless sharing of data.

IoT will have the enormous impact on the way we do business, specifically where marketing is concerned. Here’s 5 ways that IoT will improve marketing ROI:

  1. Easy Exchange of Sales Data
  2. Smarter CRM: Instantaneous Customer Analysis
  3. Devices That Know They’re Dying
  4. Predictive Social Media
  5. Imagine a 100% CTR (Click through Rate)

To learn more about IoT Initiatives for Marketing , visit here.

Follow Raghu on Twitter: @raghavitchamps

Follow ITChamps on Twitter: @ITChamps_SAP

ITChamps iEmpPower – Self Service Solutiong

iEmp-Logo

This is an alternate solution to the Employee and Manager Self Services portal by SAP. This product is available both as an on-premise solution as well as on Cloud.

It has a built-in User Management Engine (UME), a Workflow Engine and a synchronization module, which connects with the iEmpPower™ Add-on, installed in SAP ECC system. The whole integration is seamless to the user and gives an enhanced experience to the end users while saving huge amount of money to the customers in terms of licenses.

The best part of iEmpPower™ solution is that the system works in tandem with SAP as well as can work as a standalone system without SAP at the back-end. Connectors can also be built in future to any other back-end system, which the customer may already have. It can also be extended as a vendor portal and customer portal in future.

iEmpPower™ focuses on Self Services for Employee & Managers and also the primary activities of a Human Resource Administrator (HR Admin).

Features in iEmpPower™-

  • Personal Information
  • Work Timing 
  • Benefits and Payments 
  • Workflows
  • Travel Management System
  • Performance Management System

 Values Delivered – 

  • A key self-service benefit
  • Making employee value equal to company value
  • Build business case
  • Aligning your self-service strategy

SAP FICO best Practices when followed can reduce the number of issues drastically

BEST PRACTICE

  • Always have one Chart of accounts. Never complicate matters by providing for multiple COA
  • Have Minimal accounts and only augment/supplement it when there is another piece of information required for reporting
  • Copy Company Code when commencing FI Configuration
  • Rigorous period end and year end check to be in place along with postmortem analysis
  • Period end reports should be scheduled to run in background
  • Special periods are to be used only for year-end postings
  • Monitor all clearing accounts
  • Opening and Closing of Periods to be scheduled and the Period end tasks to be communicated to the Customer
  • You should advise your customer to have regular touch points with their auditors to avoid reporting changes in statutory reports
  • Ensure that manual entries are limited
  • All Generally Accepted Accounting Principles (GAAP) adjustments are to be made in the Company code from where they originate
  • Minimize the number of Adjustment entries after the Trial balances are extracted
  • Always insist on tightened workflow when it comes to approving Invoices, Payments, and Credit notes
  • GR based Invoice verification
  • Aging has to be constantly monitored
  • Automatic matching of payments to Customer/Vendor Invoices.
  • Overdue debts and its action
  • Forecast Cash receipts

www.itchamps.com

Finding Value In IoT Data

internet_of_things_480x320

One day soon, we will wake up and wonder how we ever survived in a world of “dumb” disconnected things. Our homes, including our pantries, closets, and shoe racks, and our offices, factories, and vehicles will be full of connected devices.

The World Economic Forum estimates that the number of connected devices will grow at a compound annual growth rate (CAGR) of 21.6% over the next four years from 22.9 billion in 2016 to a headline-grabbing 50.1 billion by 2020 – equivalent to almost five connected devices for every person on the planet.

By 2020, there will be an estimated 5 connected devices to every 1 person on the planet.

But that will be just the beginning. Welcome to the Internet of Things (IoT).

Underpinning the growth of IoT are tumbling prices for the sensors that turn “dumb” things into “smart” devices and capture data from the environment around them, and the vast data-centric and mostly wireless networks that connect these devices to each other and to the broader Internet.

As the sensors grow ever cheaper, and the network grows ever larger, the more data we as individuals, professionals, companies, and governments can collect and analyze to make ever more intelligent decisions.

Just like other commoditizing electronic components, fierce competition, and Moore’s Law has driven down prices, especially for accelerometers and gyroscope sensors typically used in smartphones and other mobile devices.

As a result, manufacturers can add sensor and communications modules to almost any product for a few dollars, bringing the day when everything (valued at $10 or more is) I0T-ready a big step closer.

“Our perspective is that cost of both the sensors and devices is approaching free and the size is approaching invisible,” said James Bailey, managing director of the mobility practice at Accenture, last year. “Literally everything will have IoT technology at some point.”

At the same time, the cost of embedded processors, networking and cloud-based computing – other key components in the IoT world – have all fallen.

The opportunity for transformation

IoT, particularly the Internet of Industrial Internet of Things (IoIT), is about hyperconnectivity and sensor-generated data – huge amounts of it. But the real value lies in what you can do with that data – in the outcomes it enables, rather than the collection, transmission, or storage of that data.

“We need more data-driven decision making,” said Tanja Rückert, executive vice president of Digital Assets and IoT at SAP,  during the SAP Executive Summit on the Internet of Things that took place earlier this month.

Her views were echoed by Nils Herzberg, senior vice president and global co-lead of IoT Go to Market, who stressed that “data is the fuel of the 21st century.”

Nevertheless, a recent study found that while 81 percent of business executives believe that successful adoption of industrial IoT is critical to their company’s future success, only 25 percent have a clear industrial IoT strategy.

A challenge and a huge opportunity remains for those enterprise software and services companies that have the technology and tools available to help people and businesses make sense of, analyze, and harness the tsunami of data that we are about to be engulfed by.

Here’s the real business potential to add value through IoT: Companies in almost every industry will transform into digital businesses which means oversight must be powered by real-time data – fed in large part by sensors.

As Herzberg, says, the beauty of sensors that they bring real-time data to applications: “Customers run applications for business critical processes, which could run better with real-time awareness.”

Big Data analytics and machine learning will deliver personal and business insights and will enable us to make immediate decisions based on that data – rather than relying as we have in the past, on guesswork or out-of-date forecasts. “When sensors provide real-time information, customers can make better decisions, rather than using guess work,” says Herzberg.

IoT data is already helping companies track goods on their way through the supply chain and immediately alert managers in case of theft or damage, reducing waiting times in busy ports, playing a key roll in jet engine and tractor predictive maintenance, helping farmers optimize crop yields, and improving safety across a number of public and private enterprises.

The market

So how big is the market opportunity? Cisco, the networking equipment group, predicts the global Internet of Things market will be $14.4 trillion by 2022, with the majority invested in improving customer experiences.

Cisco suggested that additional areas of investment would include reducing the time-to-market ($3T), improving supply chain and logistics ($2.7T) and cost reduction strategies ($2.5T) and increasing employee productivity ($2.5T).

But the implications of IoT and the Big Data analytics that it feeds will go far beyond traditional business models and have a profound impact on both enterprises and individuals. When combined with machine learning and cognitive computing, the insights derived from IoT data will enable us as individuals and businesses users to deploy intelligent agents empowered to make autonomous decisions and negotiate with other agents on our behalf.

This is not about machines replacing humans. Rather, intelligent apps augment humans’ ability to run the business. Predicted businesses will deploy intelligent agents across multiple areas to help all employees, from sales to suppliers to shop floor.

Things to outcomes

Ultimately, machines will help people understand connections between information by monitoring, analyzing, and correlating data that people wouldn’t see ordinarily. This helps people improve outcomes. For example, in healthcare it can mean improving patients’ recovery times.

Enterprise IoT may be Big Data’s killer app, but ultimately it is still about people.

Do Companies Get a Digital Home Field Advantage?

sap_Q316_digital_double_charted_inforgraphicThe digital technologies that are transforming the world economy have converted once-solid industry boundaries into permeable membranes through which new players may enter—or exit. But for established firms, the smartest move right now may be to reinvent their existing markets rather than pursue ventures in unfamiliar business segments.We used S&P Global Market Intelligence’s Compustat database to examine the diversification behavior of 1,932 companies in 10 industries between 2007—the year the Android operating system and the iPhone debuted—and 2015. Only a handful of firms reported entering a new market segment or exiting an existing one. Analyzing the overall returns showed companies entering new business segments (as defined by the North American Industry Classification System) increased their revenue by an average US$437 million.

However, the companies that charged into new segments were less profitable on average, as measured by return on assets, compared to companies that made no changes or that consolidated into fewer segments (the consolidating firms were the most profitable).

Given that diversification requires investment, it’s possible that companies making strategic moves into new segments have not yet realized the payoff from doing so. Nevertheless, the findings align with the conclusions of a 2015 Economist Intelligence Unit survey (sponsored by SAP) in which more than half (57%) of executives said digital disruption by established competitors posed a greater threat than new industry entrants.


In the Digital Era, Disruption Comes from Within

Companies that stay focused on core business segments are most profitable

Y-axis_4-01


Comparison of average rates of change in company-level returns on assets, 2007—2015

Find the New Business Models Within

sap_Q316_digital_double_charted_images1Digital technologies are now fundamental to creating new business opportunities, observes Pontus Siren, a partner at innovation consulting firm Innosight. Companies are finding profitable ideas close to home by using new technologies to transform processes or capitalizing on data they capture from their existing businesses. For example, Disney’s MagicBand, the chip-enabled bracelet that patrons use to buy passes, food, and souvenirs, “is a great example [of] where they are not fundamentally changing the business, but they are transforming the experience,” Siren says.

Using digital technologies to become more efficient or to create a better customer experience should ultimately lead to higher revenue and profits. But companies pursuing digital transformation need to constantly reevaluate their strategies, how they use data and innovate, how they win customers and compete, and how they define their value proposition, says David Rogers, a professor at Columbia Business School and author of The Digital Transformation Playbook.

sap_Q316_digital_double_charted_images2“The traditional idea of putting up barriers to entry and creating a unique, sustainable competitive advantage is not a winning approach anymore,” says Rogers. He argues that tying value generation to meeting evolving customer needs means that executives must be open to making investments that serve this value.

The porous boundaries of the traditional auto industry illustrate this dynamic. Personal transportation is an evolving concept with a bevy of new players: smartphone-hailed ride services from the likes of Uber and Lyft; driverless cars backed by Google; and high-performance electric vehicles with software-based support services from Tesla. These disruptions have prompted a tide of investments from incumbents. As Reuters recently reported, Toyota will invest $1 billion over the next five years in artificial intelligence to enhance driver safety. GM has taken a $500 million stake in Lyft, according to Bloomberg. And Ford, like firms in banking, retail, and industrial manufacturing, has opened an R&D center in Silicon Valley.

Keep an Eye on the Exits

Rogers notes that transformation may also lead to divestments as companies pour their efforts into digital initiatives. He points to GE, which has been working to shrink its GE Capital unit as it beefs up investment in a new business devoted to services for industrial customers using analytics and the Internet of Things.Verizon, Rogers, adds, spun off the famous Yellow Pages business telephone directory business 10 years ago when it decided to invest heavily in its high-speed fiber optic cable network for television and internet services.

“The stock market was really annoyed,” Rogers says. But it was a good call because while the unit still had market value, it was not core to Verizon’s strategy. “That takes leadership,” he says. “‘This is a cash cow, but we can see this is declining in relevance to our market. We’re not going to turn it around, so let’s take money out of it while we can.’ And then they put it in a new opportunity to create value for customers and be a growing area for them.”

Today’s strategic choices involve the same criteria. “Looking to use digital technologies, through the lens of ‘How can I use this to create a new offering and additional value to my existing customers?’ sometimes opens doors to additional customers,” Rogers says. “And sometimes that involves building novel business models that are new to your company.” D!

How To Fix The Personalization Paradox

272398_l_srgb_s_gl.jpg

Customers are signaling that they want more personalized treatment from companies. In fact, a recent Accenture survey revealed that nearly 60% of respondents prefer real-time promotions and offers. That may seem like great news for marketers. But personalization strategies also come with risk.

Personalization creates more intimacy in the customer relationship, which can lead to more sales and loyalty. This promise of a tighter bond with customers has driven personalization to the top of marketers’ strategic agendas for 2016. However, this approach can threaten the most important aspect of the customer relationship: trust.

The tug-of-war over data

For personalization to work, brands need to gather detailed information about customers. But when asked whether they are willing to give up that information in return for more targeted products and promotions, many customers balk. Of the Accenture survey respondents, for example, only 20% were willing to reveal their location, and just 14% would consider parting with their browsing history.

This personalization paradox, as it is known, has been around for decades. But it’s going to become a bigger issue as digital connectivity increases and the data that customers generate through their activities—whether it be jogging with a Fitbit or refilling a fridge connected to the Internet of Things—outline their lives in ever-finer digital detail.

Complicating the situation, most customers aren’t very well-informed when it comes to data privacy. For example, a survey by the Annenberg School for Communication at the University of Pennsylvania found that 54% of respondents wrongly believe a website’s privacy policy means that the site would not share their information without their permission.

Focus on trust and value

How can companies reduce customer fear, ignorance, and uncertainty about personalization and privacy?Research has found that customers are more likely to take advantage of personalization from companies they trust and that offer them real value in exchange for their information.

It’s important to emphasize trust in the customer relationship because it’s at a low ebb. For example, just 7% of customers say the offers they receive from companies are consistently relevant. And 27% have said they’ve stopped visiting a website or mobile app after receiving irrelevant information or product recommendations.

Bonus: Learn how companies can create moments that matter to customers, anytime and anywhere in the white paper “Live Customer Experiences for the Digital Economy.”

In this kind of a climate, companies must demonstrate that they are worthy of customers’ trust before pushing too hard on personalization. Research has shown that there are two components of trust:

  • Confidence. Customers must believe that the company can provide a quality product or service.
  • Benevolence. Customers must believe that the company is willing to consider every customer’s self-interest above their own.

The benevolence aspect of trust is particularly important when it comes to personalization. In this regard, companies demonstrate benevolence by offering clear, understandable data collection and usage policies and by giving customers control over their information and how it is used. Customers are hungry for that control. A Pew Research Center survey found that 90% of those surveyed want to decide what information is collected about them.

Once trust is established, personalization has to offer real value. That value could come through useful services or discounts, for example. The key is to avoid stepping over the invisible line from cool to creepy, such as the time when Target sent coupons for diapers to an expectant teen before her father knew of the pregnancy.

Of course, the personalization paradox and online privacy are issues as big as the Internet. Customers will continue to fear for their privacy as long as data breaches continue and irrelevant and offensive offers continue to hit their inboxes. But focusing on trust is the beginning of a solution.

A Catalog of Civic Data Use Cases

1682405-poster-wwwnewschallenge.jpeg

How can data and analytics be used to enhance city operations?

What kinds of operations-enhancing questions have cities asked and answered with data and analytics? The catalog below is an ongoing, regularly-updated resource for those interested in knowing what specific use cases can be addressed using more advanced data and analysis techniques.

For examples that are currently being implemented in cities across the country, you can click to expand the question to see additional information about the solution.  All other examples represent potential questions that cities could work to address with data and analytics.

We welcome further submissions to the list by email.  Submissions can include either current examples of how cities are addressing specific operational or policy issues with data, or ideas for how to address issues that you hope cities will one day be able to answer.

HEALTH & HUMAN SERVICES

INFRASTRUCTURE

PUBLIC SAFETY

REGULATION

  • Can we determine where unsafe housing problems are unlikely to be reported through 311?
  • How can we use analytics to prioritize accessibility inspections for building alterations, and make sure they are compliant with municipal building code and state accessibility requirements?
  • Who is most likely to be guilty of financial crimes and fraud?
  • How can inspectors reduce response time to maintenance complaints?
  • How can we prioritize annual elevator safety inspections?  For example, can we predict or identify which elevators pass every year and could be outsourced to a 3rd party?
  • How can we predict vacant or abandoned buildings before they reach that status?  To do so, can we use court foreclosure filings, US Postal “undeliverable” data, tax information, and data outside government, such as utility bill records?
  • Which construction / renovation projects are the highest risk / should be inspected first?
  • Which buildings are the highest risk / should be inspected first?
  • Which equipment (such as boilers, elevators, cranes, vehicles, etc.) is the highest risk / should be inspected first?
  • What variables affect inspector productivity and which can be most easily influenced? What distinctions can be made between inspectors who complete a high number of inspections and those who are at the bottom end?
  • Based on the relationship between inspections and violations, what building inspection regimens are most effective at preventing violations from occuring?
  • How many inter-agency inspections are conducted each year? Do they effectively detect current violations?
  • Which city debts are least likely to be paid?
  • Which taxpayers are least like to pay?
  • What city blocks need more inspection enforcement?
  • Which businesses are most likely to be violating weights and measures?
  • How can we determine what businesses will have over-occupancy issues, including multiple incidents of over-crowding?
  • How can we tap social media for information on illegal businesses?
  • What property owners, architects, developers, businesses and landlords need more regulatory enforcement?
  • How can we use social media to ensure licenses are conducting legal business?
  • Can we predict which stores sell cigarettes to youth?
  • How can we target stores that sell outdated food or expired baby formula?
  • Does the order of inspections (building, health, or fire) increase the rate of violation?

Profitability Analysis and CO with Simple Finance

customer-profitability-newport-board-group.png

This post will give the functionalities offered by Simple finance in COPA and management accounting

The long pending requirement from the majority of the customers in manufacturing industry is getting the COGS break up each head wise and it needs to post to a different GL account, in this way COPA is in sync with FI and it reduces the lot of reconciliation issues, the same issue has been addressed in simplified profitability analysis and it is part of simple finance.

In CO the main focus is to reduce the month end closing activities time and increase the system performance, In Sfin we have a separate set of transaction codes to perform this activity.

  • In simple finance, SAP is recommending for Account based COPA, account base in the default solution as the advantages of costing base has been incorporated in account base, as well enhancing the reconciliation aspect by having single document for Finance and COPA through universal journal entry, and improving the performance through the use of S/4 Hana database. No change in costing base approach.
  • The COEP, COSS and COSP tables are replaced with ACDOCA.
  • View tables are also available to reproduce the data in the old structure, for example V_COEP would allow seeing actual postings.
  • Assessments with in CO will update the COEP for CO documents and accounting documents with ACDOCA
  • Table ACDOCA would store both FI and CO posting in a unified document. As account based COPA posted is same as CO posting, the characteristic of account based COPA would also be part of ACDOCA

1.jpg

2.jpg

Configuration for splitting the cost of goods sold:

IMG: Spro > General Ledger Accounting (New) > Periodic Processing > Integration > Materials Management > Define Accounts for Splitting the Cost of Goods Sold

In Account Based COPA, there was no option to have a split of the Cost of Goods Sold into its components. This did not allow business to compare the component level costs of the inventory in terms of plan and actual, which can be basis of production re engineering. With Simple Finance, this option has been made available in account based COPA.

3.jpg

Configuration for additional quantities:

Spro > Controlling > General Controlling > Additional Quantities > Define Additional Quantity Fields

Additional quantity field can be configured. Badi FCO_COEP_QUANTITY has to be used.

4.jpg

In Simple Finance, the settings for Profitability Segment Characteristic is not supported any more, as each profitability segment contains all available characteristic values.

5.gif

With Simple Finance, Integrated Business Planning would be in general used for overall Planning purpose. However planning available in account based COPA would continue to exist, as it exists before. But with additional flexibility IBP would be the primary Planning tool going forward.

For Reporting User Interface tools like Lumira would be used. This gives additional flexibility of query based reporting, real time value updation etc. However Ke30 reports can still be created.

With the simple finance, the benefits like reconciliation with financials, system performance, cost of goods sold and IBP is as follows.

6.jpg

I hope this post will give some inputs on COPA in simple finance, Happy learning and welcome your valuable comments.

Visit – www.itchamps.com

@ITChamps_SAP – Pure Play SAP Consulting Firm

Do You Have A Mobile Strategy?

Man using tablet computer at station

Mobility is a key strategic initiative for both consumer and B2B facing companies, as over two-thirds of the IT leaders Lopez Research surveyed listed mobile-enabling the business as a top priority in 2016. Yet, only 48% of the firms interviewed have a formal mobile strategy in place. This disconnect between crafting a mobile strategy and deploying mobile applications can dramatically decrease the effectiveness of a company’s mobile efforts. For example, a mobile strategy should define the architectural approach for connecting data from Systems of Record and engagement, such as ERP, CRM, and SCM, to mobile applications. Without this, the apps development team is building a pretty user interface that can’t connect to transactional systems.

Three Phases of Mobile Strategy

Most companies will evolve to mobile-empowered businesses in three phases that Lopez Research defines as extend, enhance, and evolve.

Phase 1: Extend existing apps to mobile

A majority of organizations, regardless of the presence of a formal mobile strategy, are extending a subset of existing applications to mobile devices today. In many cases, these are micro apps that offer a subset of the features found within PC applications. Examples of micro apps include approvals, expense reporting, and time tracking. During the initial stages of mobile enablement, many companies focus on delivering paper-replacement applications such as forms, price lists, and brochures. In this phase, companies are supporting only a few apps, and the issues associated with foregoing a formal mobile strategy aren’t obvious.

Phase 2: Advance capabilities of existing apps

As firms move into the second phase, IT is advancing the capabilities of existing apps by adding new functionality found in mobile devices such as image capture, bar-code scanning, and availability of location data. For example, retailers are improving in-store customer service with mobile information access and recommendations engines. Industrial industries are minimizing downtime by adding sensor data, such as temperature and vibration, to new mobile apps for plant managers. Across industries, organizations will be creating mobile solutions that use new data and device functions (e.g. camera, voice navigation, and location) to gain efficiencies and improve business with better information such as location data, voice-enablement, and image capture. It’s during phase two that companies realize they need a strategy to manage and secure mobile applications, scale mobile application development, and align with the business KPIs for digital transformation.

Phase 3: Focus on mobile to reinvent business models and processes

In the final phase of mobile-enablement, companies have already deployed foundation technologies such as enterprise mobile management, mobile application development platforms, and agile dev-ops processes. At this point, IT will focus on leveraging mobility as part of a toolkit to reinvent internal processes and transform business models. For example, product manufacturers are shifting to digital service models that couple hardware with subscription services accessed via mobile devices. Companies will offer contextual services by combining information such as location, device type, previous transactions, social media sentiment, and current process.

Create a clear mobile strategy

A mobile strategy, while its own entity, is also a critical part of a company’s overall digital transformation strategy. Mobile technology provides new contextual elements such as location, sensor data, and image-capture information that can enhance business processes. It also introduces new design paradigms such as touch and voice navigation. These attributes, coupled with the portability mobile provides, are key enablers of transforming digital business processes.

The mobile strategy should be interlaced with other IT initiatives such as cloud computing, data processing, and analytics strategies. As companies look to build new mobile applications, the cloud can provide many mobile services such as a development and testing environment, cloud-based mobile application middleware and development tools, as well as Analytics-as-a-Service capabilities. Additionally, companies can look to cloud-resident SaaS applications to deliver mobile applications that operate seamlessly on the latest mobile devices. Mobility can deliver both efficiencies and competitive differentiation if IT and the line of business managers come together to build a strategy.

Application Integration Made Simple with SAP HANA Cloud Integration

HANA Integrations Services is built from scratch to assist customers to smoothly integrate with on-premise systems. The course also addresses typical integration challenges, an overview of the Integration Technology, how pre-packaged Integration Flows, Out of the Box solutions, supports multi-tenancy, HCI software updates, security, data isolation and license/packages available for customers/partners.

1.pngReference – Unit 1 Slide 6

Most import to understand how the End to End Web Tooling works and different phases during the integrations scenarios as also discussed. Unit 1 also covers some customer examples.

2.pngReference – Unit 1 Slide 7

Unit 2 – Introduction to Web UI

This unit would be the most important unit which helps to understand the Web UI and how it really helps to solve the integration scenarios. The course discusses

1. Discover

A pre-packaged content from Integration Catalogue, which can be copied to your workspace and make adjustments to your needs

3.pngReference – Unit 2 Slide 16

2. Design

This phase is used for configurations and customizing as per user requirement, it offers you Modeling Area, Pallets, properties etc.

4.png

Reference – Unit 2 Slide 17

3. Run & Monitor –

Once you have the configurations done, deploy the package and analyse the deployed package from Monitor section.

5.png

Reference – Unit 2 Slide 18

This unit has a demonstration scenario which really really helps to understand all the phases of the HCI.


Unit 3 – Configuring Pre-Packaged Integration Content

Now, it time to get you hands a little dirty. In this unit we shall start to understand on how to search for a pre-configured package from catalogue, how to copy them and rename it to avoid conflicts (this option has a minor change, as I did get option to rename it when I clicked on copy, however, option was given to rename when I started editing it), how to configure the source and destination integration flow, edit the connection details and deploy them. Final at the end of the course we also learn to Monitor.

6.png

Reference – Unit 3 Slide 27

Do not forget to look at the demo on this complete scenario.


Unit 4 – Creating Integration Processes from Scratch

I would say, Unit 4 and Unit 5 are the most important things of this Week1 course. This unit talks about the Integration Process from scratch and introduces you to “Apache Camel” and a book related to “Camel In Action” by Claus Ibsen and Jonathan Anstey and “Enterprise Integration Pattern” by Gregor Hohpe and Bobby Woolf.

7.png

Reference – Unit 4 Slide 41

The above image, explains how a Sender Component talks to a Receiver Components and how the messages are processed via integration channels and what are the process and underlying framework used. The unit then continues with a hands-on demo on explaining about creating a new Process Integration and testing it with an SFTP file transfer. You will also understand how to monitor and verify the successful data transfer.


I would recommend doing this exercise to get an understanding of Integration Services.


Unit 5 – Working with Data in SAP HANA Cloud Integration

This unit focuses on explaining the Data formats used and what are the fundamental properties of a Message, Exchange (a message’s container during routing) etc.

8.png

Reference – Unit 5 Slide 55

9.png

Reference – Unit 5 Slide 56

Once we understand the message and exchange formats, there is a simple scenario to help us to understand the message model, this is covered as a hands-on exercise.

10.png

Reference – Unit 5 Slide 57

Follow the Video and configure the communication channel and content modifier. Once done, you should be able to test it with an SOAPUI.